
“Quick answerReal-time property market data is inventory, pricing and condition read as they change rather than reported monthly. We ran the same Cleveland screen on 3 consecutive days. Active listings went from 960 to 1,010, and the houses needing work went from 193 to 209. An investor screening weekly sees that movement on day 7. The cost of lagging data is the deals that sold while you were reading last month’s report.”

Most market reports describe a month that has already finished. They are useful for understanding a trend and useless for buying a house this week.
Inventory turns over continuously. The listing you would have wanted was on the market while you were reading about last month.
Put the Cleveland rate against a weekly habit. 50 new listings in 48 hours works out near 175 in a week, and roughly 1 in 5 of them needs work. Screen on Mondays and you meet that week of inventory after everyone who screened on Tuesday.
What changed in 48 hours
We ran the same screen against our property database on 5, 6 and 7 October 2026. One endpoint, one city, active status, no other filter.
| Cleveland | 5 October | 6 October | 7 October | Change |
|---|---|---|---|---|
| Active listings | 960 | 1,000 | 1,010 | Up 50 |
| Outdated, poor or very poor condition | 193 | 201 | 209 | Up 16 |
Homesage.ai property database, Cleveland active listings, 5 to 7 October 2026.
50 properties in 2 days is not a dramatic market. It is an ordinary one, and that is the point.
The method matters as much as the number. Same endpoint each day, same city, same status, no other filter. A count only means something when the way you took it does not move.
The same screen run on Columbus on 7 October returned 1,622 active listings and 178 needing work. That is 11% against Cleveland’s 21%. 2 cities in one state, and nearly double the share of houses needing work in one of them.
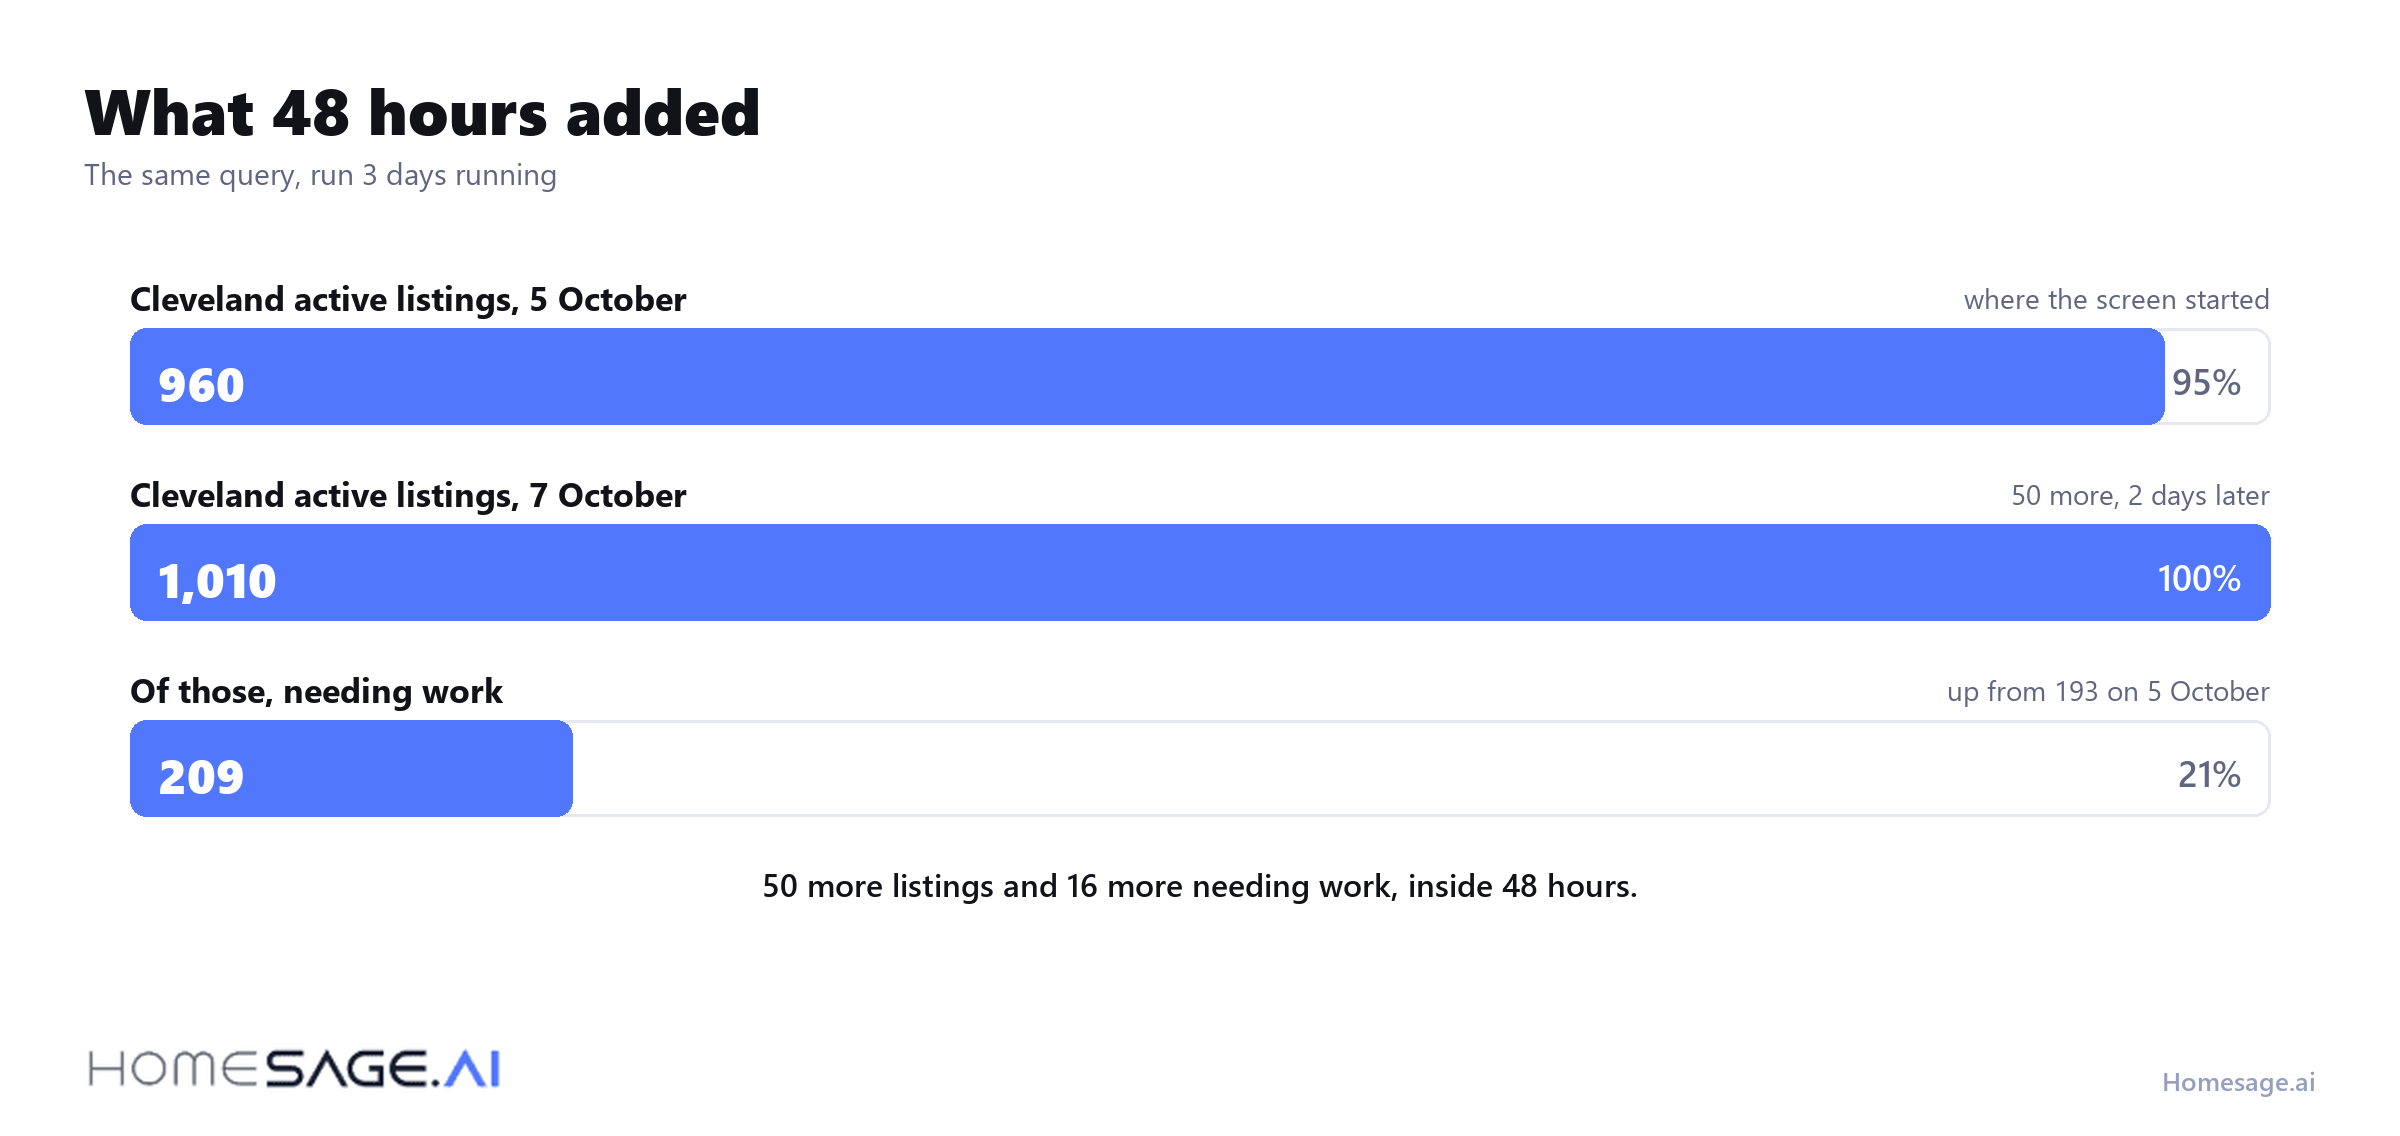
Your data is a snapshot. The market is not. The distance between the 2 grows every day you do not refresh.
What slow data actually costs
The cost is not abstract, and it is not the subscription. It is the listings that were available while your screen was out of date.
Take the Cleveland rate. 50 new listings in 48 hours. Roughly 1 in 5 of them needs work, and that is the segment an investor buying below market hunts. Screen once a week and the oldest of those listings has been public for 7 days by the time you meet it.
7 days is long enough for the well-priced ones to go under contract and the badly-priced ones to still be sitting there. A stale screen does not show you a random sample of the market. It shows you what nobody else wanted.
The same arithmetic runs the other way on price cuts. A seller who cut the asking price on Tuesday is at their most responsive that week. A Monday screen meets them 6 days late.
Real-time against lagging data
Both describe the same market. Only one of them answers a question you are asking this week.
| What you are deciding | A monthly report tells you | A live screen tells you |
|---|---|---|
| Whether to make an offer this week | How many homes sold last month | What is for sale right now, and the property condition of each one |
| What to offer | An average sale price for the metro | Recent comparable sales behind an estimated ARV |
| Whether a seller will move | A median days-on-market figure | The days on market on that listing, and whether the price has been cut |
| Whether the market is cooling | A trend line that ended 30 days ago | Inventory rising this week |
The monthly report is not wrong. It answers a different question, and investors lose money by treating a trend summary as a buying signal.
How often each signal changes
Refreshing everything daily is wasted effort. These are the cadences that matter.
- Inventory, daily. Cleveland added 50 listings in 48 hours.
- Price cuts, daily. The shortest-lived signal in the screen, and the one that moves a negotiation.
- Days on market, daily. It only counts up, so a weekly screen misreads every listing by up to 7 days.
- Property condition, at listing time. Read from the photos when the listing appears, then stable until the listing changes.
- Comparable sales, weekly. Closings land in batches, so a daily pull on comps mostly returns yesterday’s answer.
What real-time market data actually includes
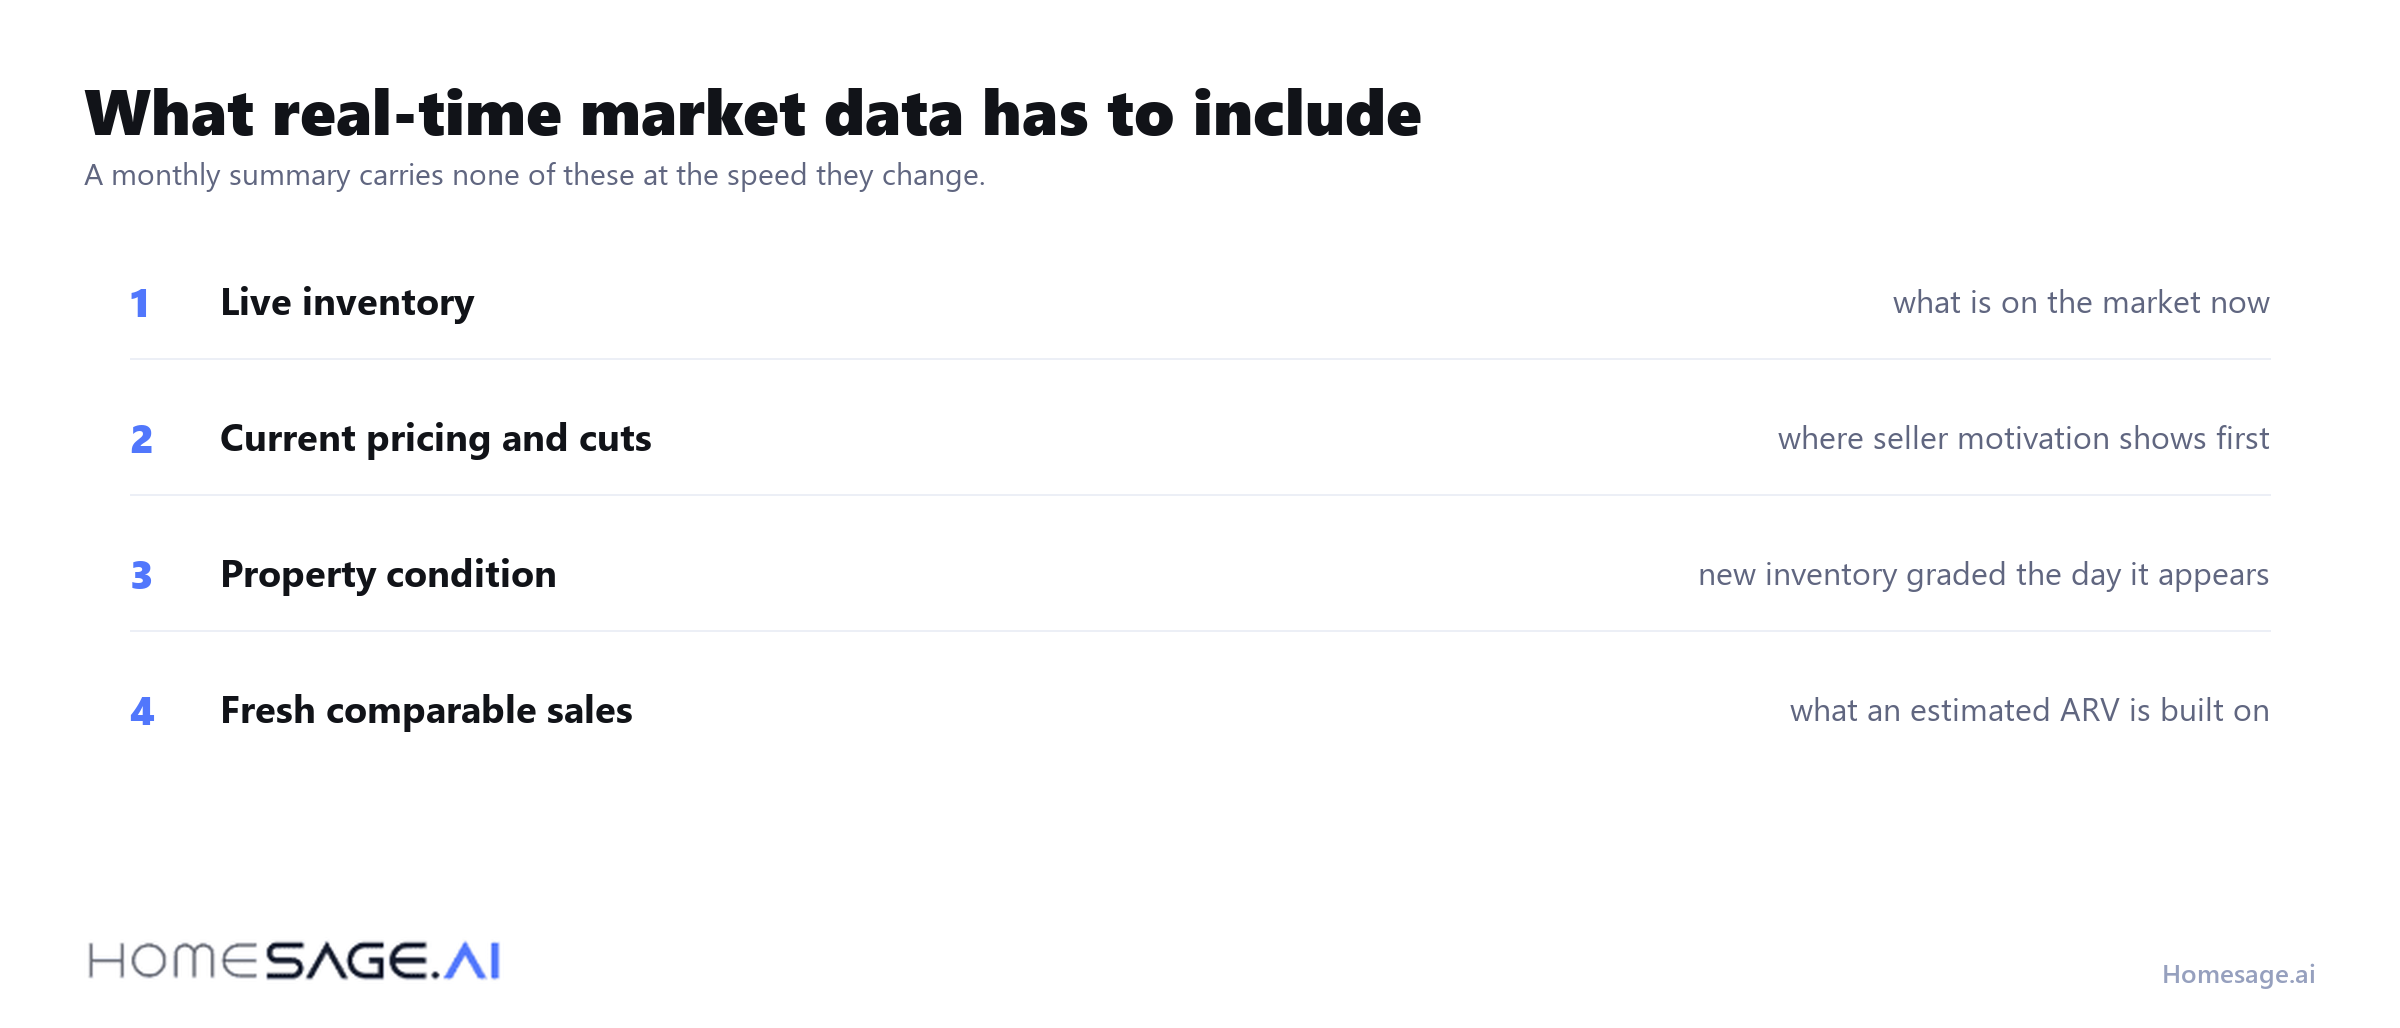
- Live inventory. What is on the market now, not what sold last quarter.
- Current pricing and cuts. Asking prices as they move, which is where seller motivation shows up first.
- Property condition. A property condition score read from the listing photos, so new inventory is graded the day it appears.
- Fresh comparable sales. Recent sold prices, which is what an estimated ARV is built on.
4 ways investors use it
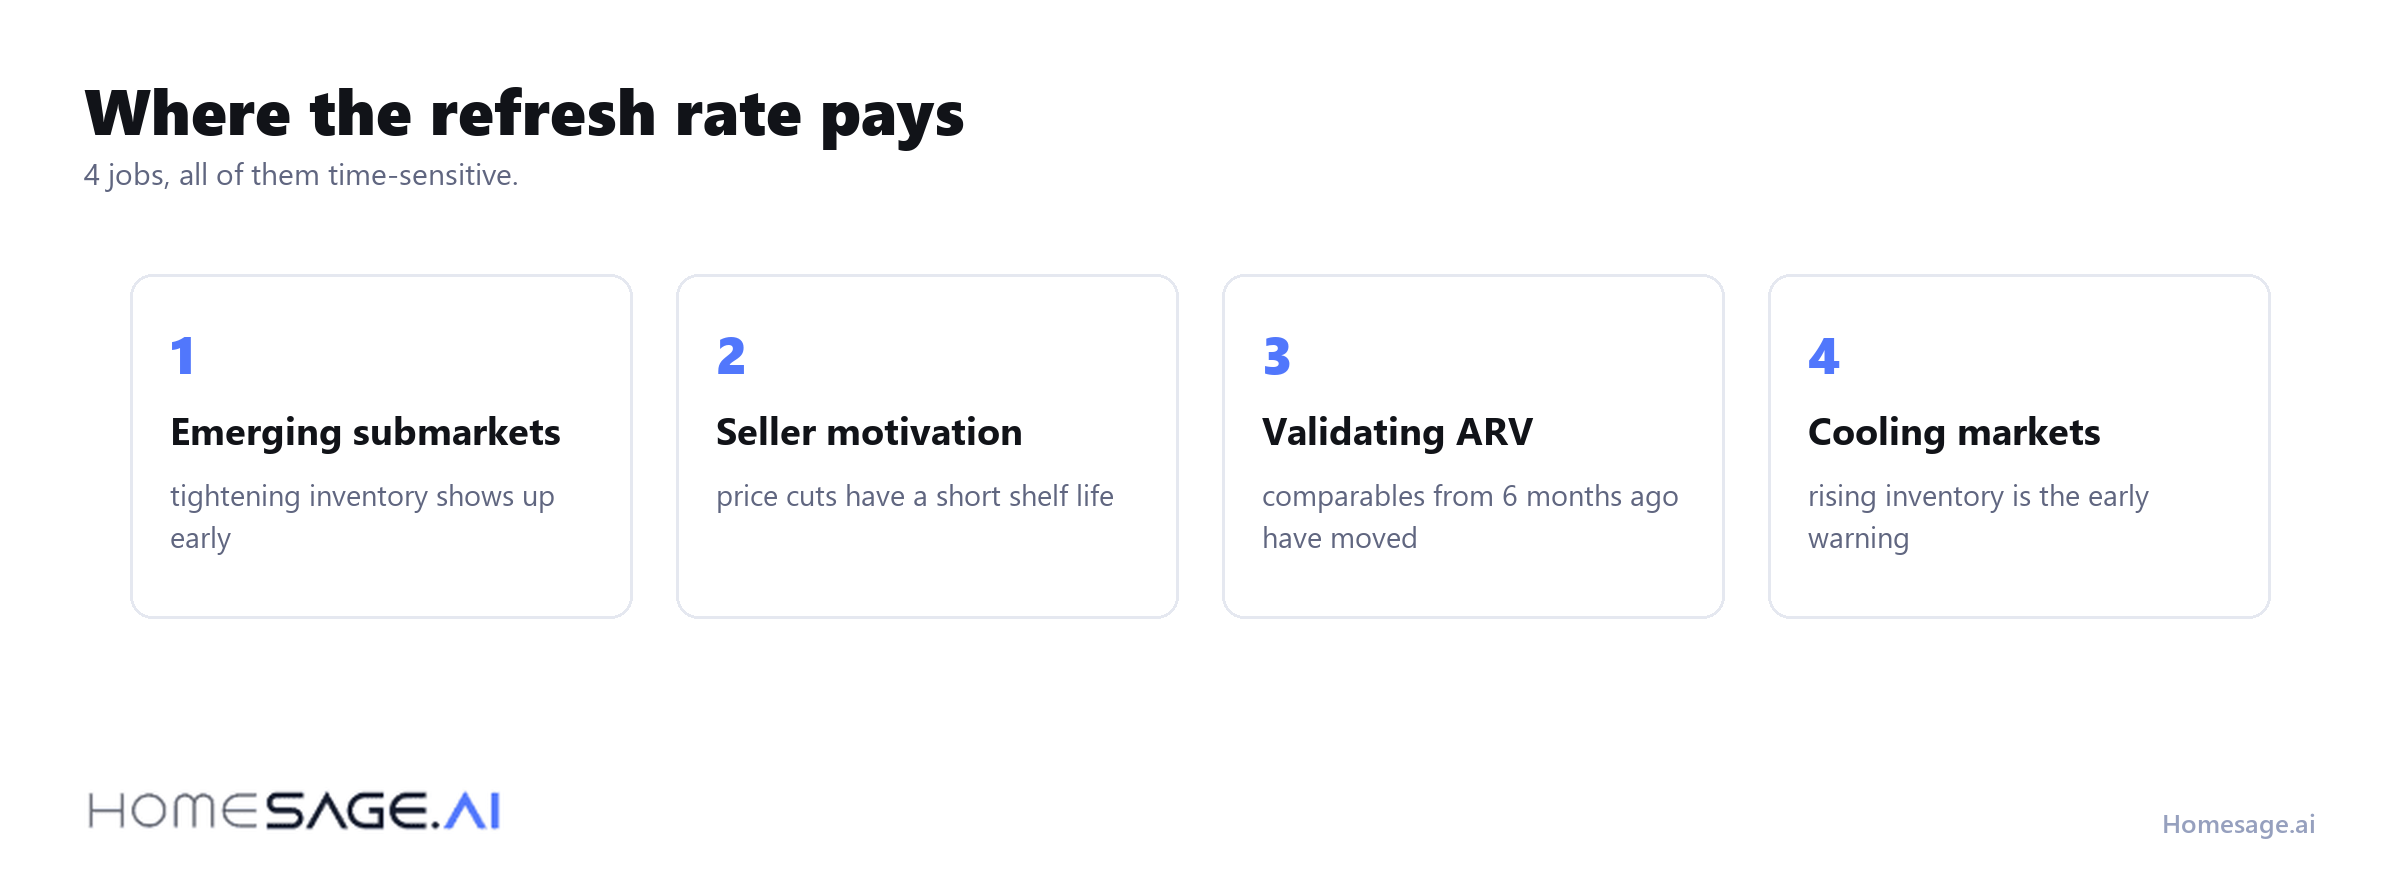
1. Spotting submarkets before the competition
A ZIP code where inventory tightens and prices firm is visible in the data weeks before it is obvious on the street.
Cleveland and Columbus sit 2 hours apart and returned 21% and 11% of listings needing work on the same day. A submarket read is that same comparison one level down, at ZIP code rather than city.
2. Timing an approach to a motivated seller
Price cuts and long days on market are signals with a shelf life. A month-old report has already missed the window.
Days on market only counts up. A listing you first meet on day 7 of a weekly screen has been in front of every other buyer for a week. The seller has had that week of silence to react to.
3. Validating an estimated ARV against fresh sales
An estimated ARV built on comparables from 6 months ago describes a market that has moved. Recent sales keep the number honest.
One Cleveland rental in our 6 October pull carried a $120,000 asking price against a $138,867 estimated ARV. An $18,867 spread is worth acting on or ignoring depending entirely on when the comparables behind it closed.
4. Protecting capital when a market cools
Rising inventory and lengthening days on market are the early warning. They show up in live counts long before they reach a quarterly summary.
50 listings in 48 hours is noise on its own. The same slope held for a month is a cooling market. You only see a slope by measuring more often than the thing you are measuring moves.
Getting this without a research team
Institutional buyers pay analysts to watch inventory daily. An independent investor does not need to match that headcount, only the refresh rate.
Homesage.ai carries insights on 155M+ US properties and scores new inventory as it appears, so a screen you run today reflects today.
A single report reads the same way. Listing price, estimated ARV, the spread, the property condition and the return are computed when you open the report. A monthly summary computed them whenever it was last compiled.
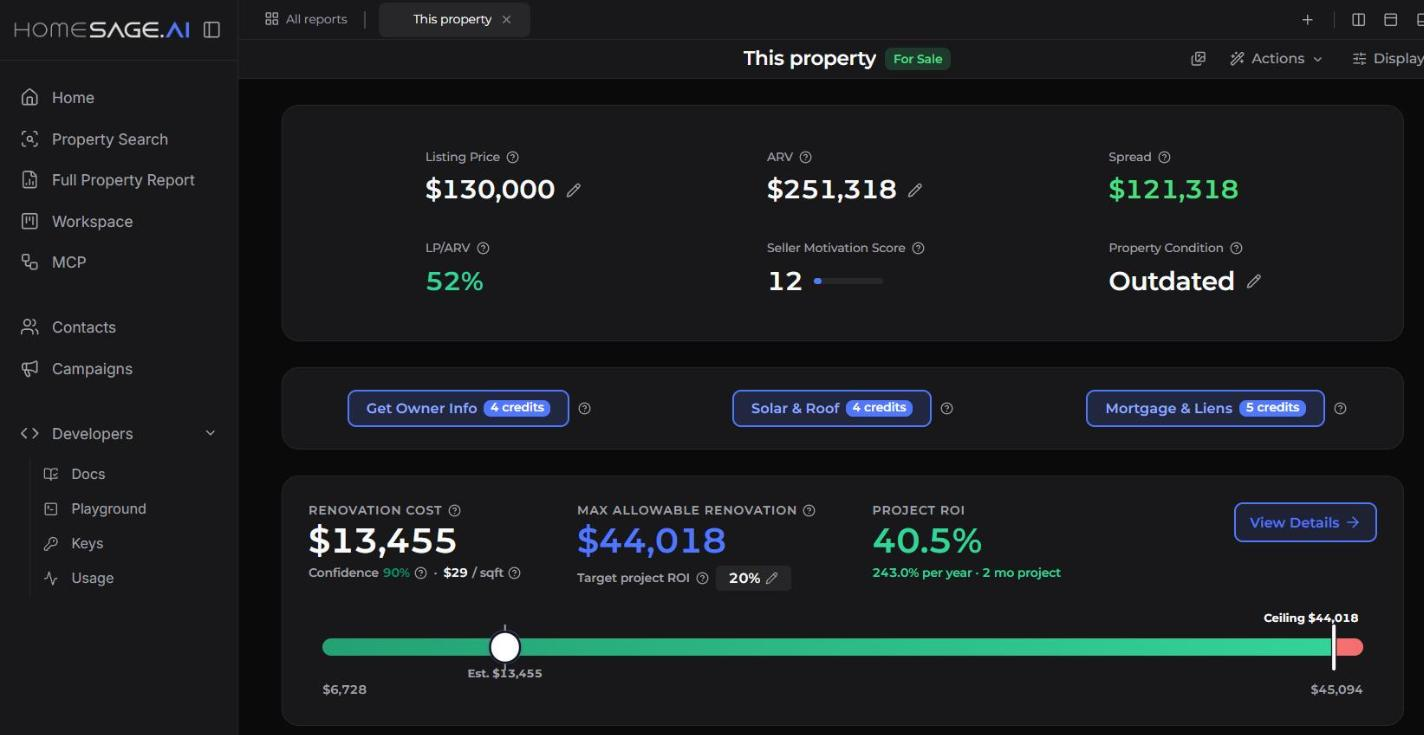
Here is a short video on what a single property report returns.
What we did not measure
3 days in 1 city is a demonstration, not a study. 4 limits are worth stating.
- One city. Cleveland is a high-turnover market. A thinner market moves less in 48 hours, which makes a weekly screen cheaper there, not free.
- One endpoint. Counts came from the same property-database search each day. A different surface counts a slightly different universe, so mixing sources inside one series would break the comparison.
- Time of day. Listings appear through the day. A count taken each morning is consistent rather than complete.
- Gross movement is invisible. Active listings up 50 is the net figure. The number that appeared and the number that went under contract are both larger, and the net hides them.
None of that changes the direction. It does mean the right question is how fast your market moves, not how fast ours did.
What real-time data does not do
Faster data is not better judgment. A live count tells you what exists. It never tells you what to buy.
It also does not shorten diligence. The inspection, the appraisal and the lender all take the time they take.
Ask Sage for today’s numbers
Sage is our AI assistant, and it runs the screen from a plain-language question inside the AI tool you already use.
Connect Homesage.ai to Claude, ChatGPT, Gemini or Perplexity through our Real Estate MCP and ask about the market you are watching.
“How many active listings are in this city today, and how many need work?”
Setting this up in ChatGPT takes 3 steps. Connect to ChatGPT in the MCP portal, then ask in plain language.
Key takeaways
- A monthly report describes a market that has already moved.
- Cleveland active listings went from 960 to 1,010 between 5 and 7 October 2026.
- Houses needing work went from 193 to 209 over the same 48 hours.
- Price cuts and days on market are the signals with the shortest shelf life.
- Refresh rate is what an independent investor can match. Headcount is not.
Conclusion
Speed is the whole advantage. A screen you ran last month describes a market that has already moved on.
Cleveland went from 960 active listings to 1,010 in 48 hours, and the houses needing work went from 193 to 209. That is an ordinary 2 days in one city.
Run the screen weekly and you meet 7 days of inventory at once. The well-priced listings are already under contract, and every day-on-market figure you read is up to 7 days out of date.
Your market may move slower. Columbus returned 11% of listings needing work against Cleveland’s 21% on the same day, so the question worth answering is how fast your own metro turns over.
Start with an API key and run the same screen on 2 consecutive days.
Frequently asked questions
What are real-time property market insights?
How fast does the market actually move?
How is this different from predictive analytics?
How often should market data be refreshed?
Can independent investors get institutional-grade data?
Estimated values. Not investment advice. Data as of 2026-10-07. Counts come from the Homesage.ai property database and change daily. Property condition is read from listing photos and is not a substitute for an inspection. Evaluate every property against your own finances, local costs and a professional inspection.




Lin May 26, 2026
Very insightful
Mike May 26, 2026
Few good ideas for a real estate investors