
What a ZIP code market forecast means
A national forecast averages thousands of local markets. The market outlook in a Full Property Report narrows that down to the metro area and the ZIP code your property sells into.
The forecast and days to pending cover the whole metro area. Sales and listings cover the ZIP code alone.
- Estimated forecast: the estimated price change for the metro area over the next 1 and 3 months.
- Absorption: homes sold in the ZIP code in the last 90 days as a share of active listings.
- Days to pending: the average number of days metro area homes take to go under contract.
- Market score: a reading from 0 to 100. It combines a metro market-heat index with ZIP code sales speed, plus a live market signal when one is available.
A real example from 3 ZIP codes
We read the market outlook for 3 ZIP codes on 23 October 2026, one in each metro area.
| What the report shows | Detroit, MI 48214 | Phoenix, AZ 85015 | Atlanta, GA 30318 |
|---|---|---|---|
| Estimated forecast, 1 month (metro) | +0.2% | -0.1% | -0.1% |
| Estimated forecast, 3 months (metro) | +0.9% | 0.0% | -0.7% |
| Active listings | 111 | 114 | 384 |
| Sold in the last 90 days | 133 | 113 | 1,312 |
| Absorption | 120% | 99% | 342% |
| Avg. days to pending (metro) | 36 | 62 | 72 |
The Detroit metro has the only rising forecast of the 3, at an estimated +0.9% over 3 months. The Atlanta metro sits at an estimated -0.7%. The Phoenix metro is flat over 3 months and down an estimated 0.1% over the next month.
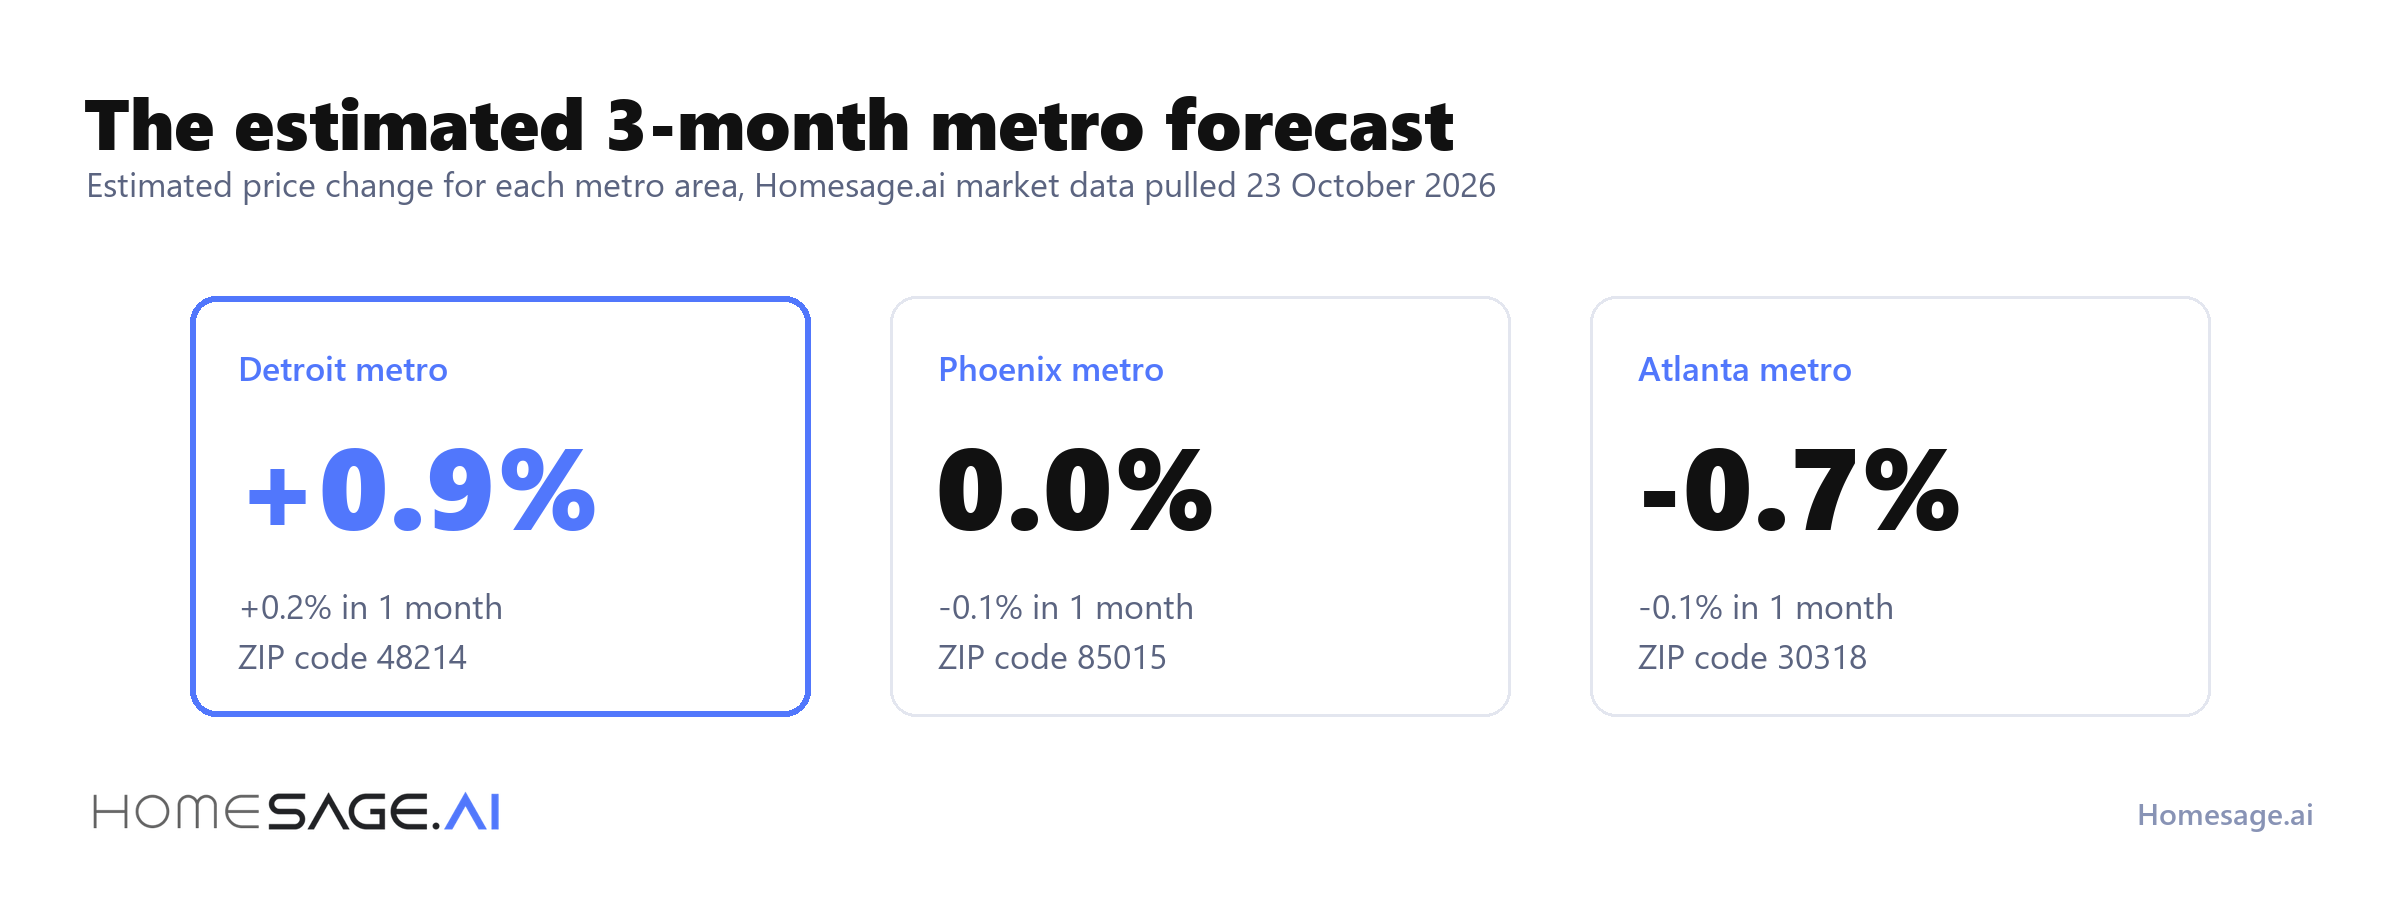
The Detroit metro is rising at an estimated +0.9% over 3 months. The Atlanta metro is slipping at -0.7%.
Speed points the same way. Detroit metro homes went to pending in 36 days on average, against 62 days in Phoenix and 72 days in Atlanta.
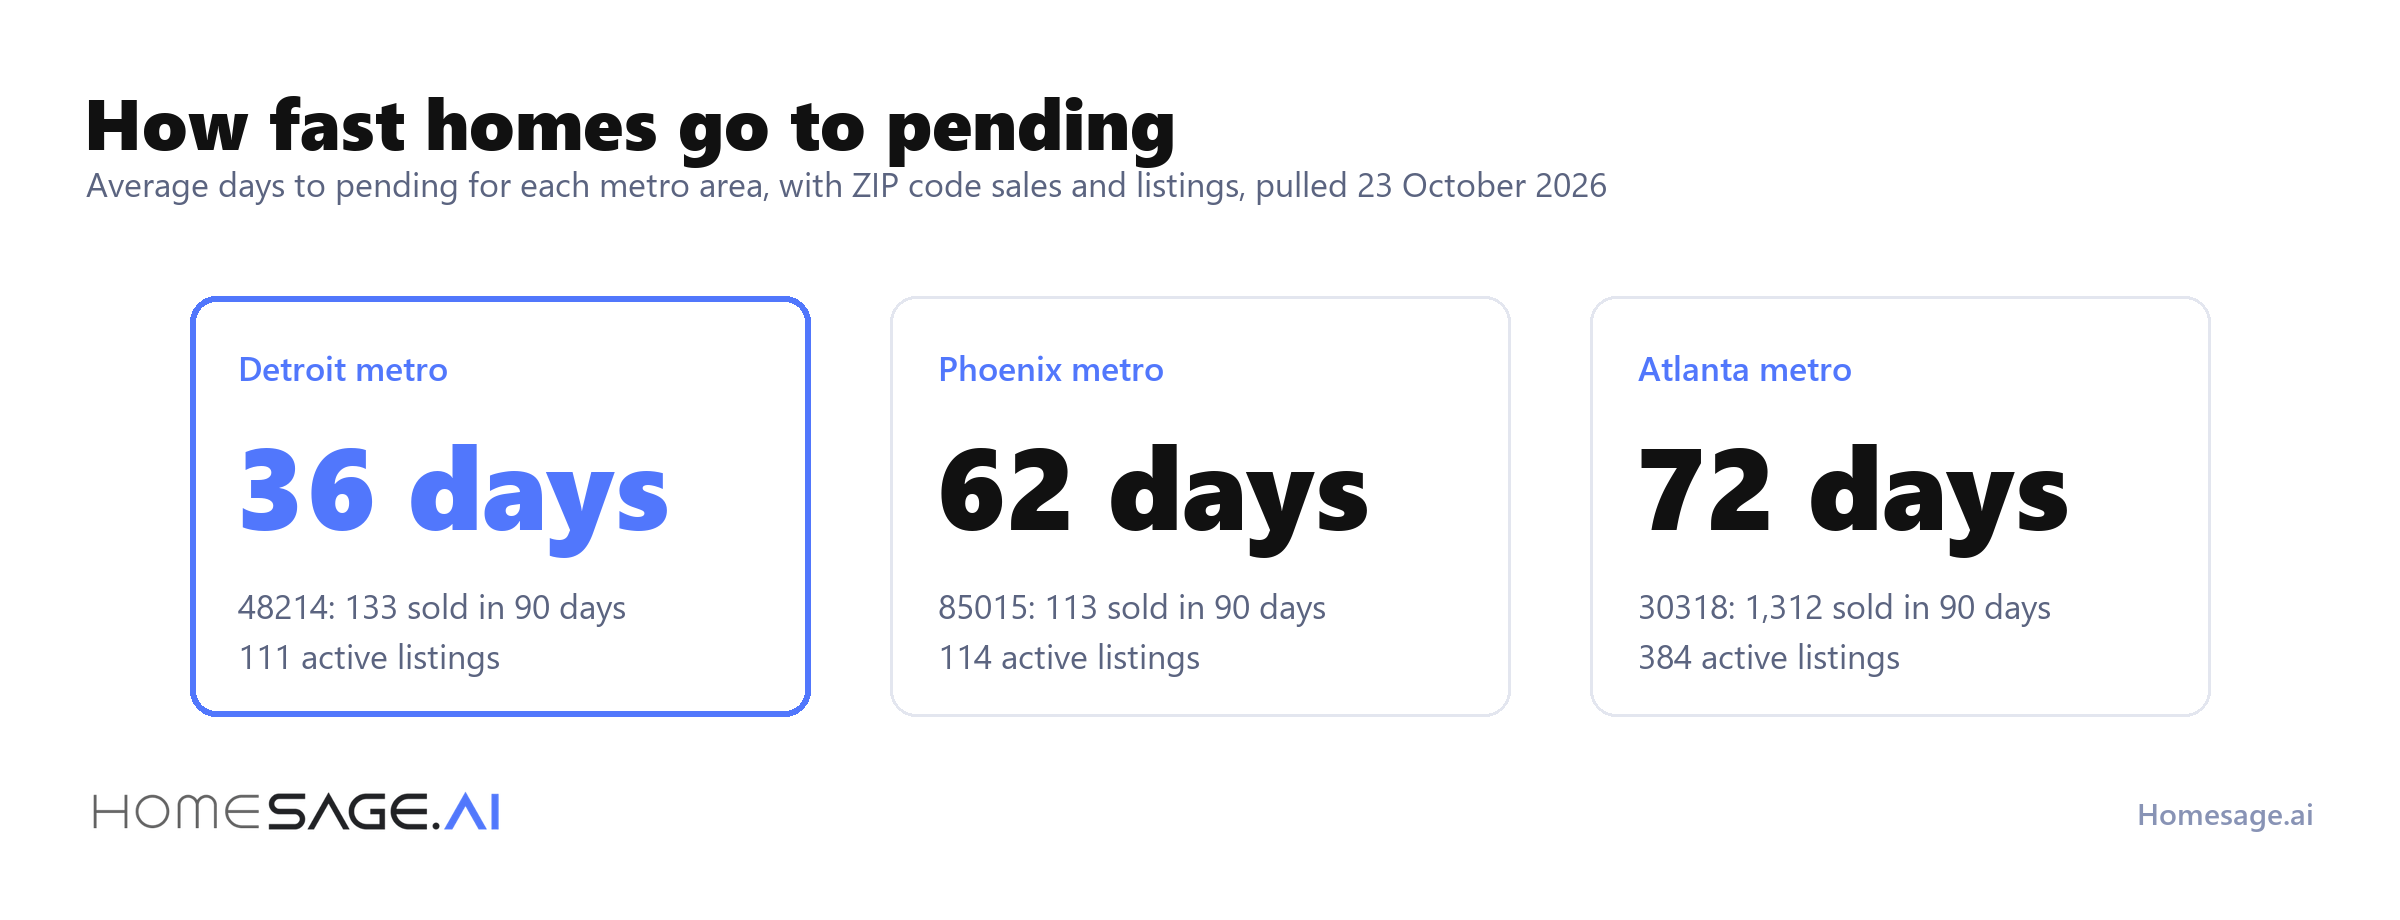
Absorption reads the ZIP code alone. Atlanta 30318 sold 1,312 homes in 90 days against 384 active listings, an absorption of 342%. A busy ZIP code can still sit inside a metro area with a falling forecast.
In dollars, an estimated -0.7% over 3 months on a $449,900 Atlanta listing is about $3,149. An estimated +0.9% on a $165,000 Detroit listing is about $1,485.
How to work out what the forecast means for your ZIP code
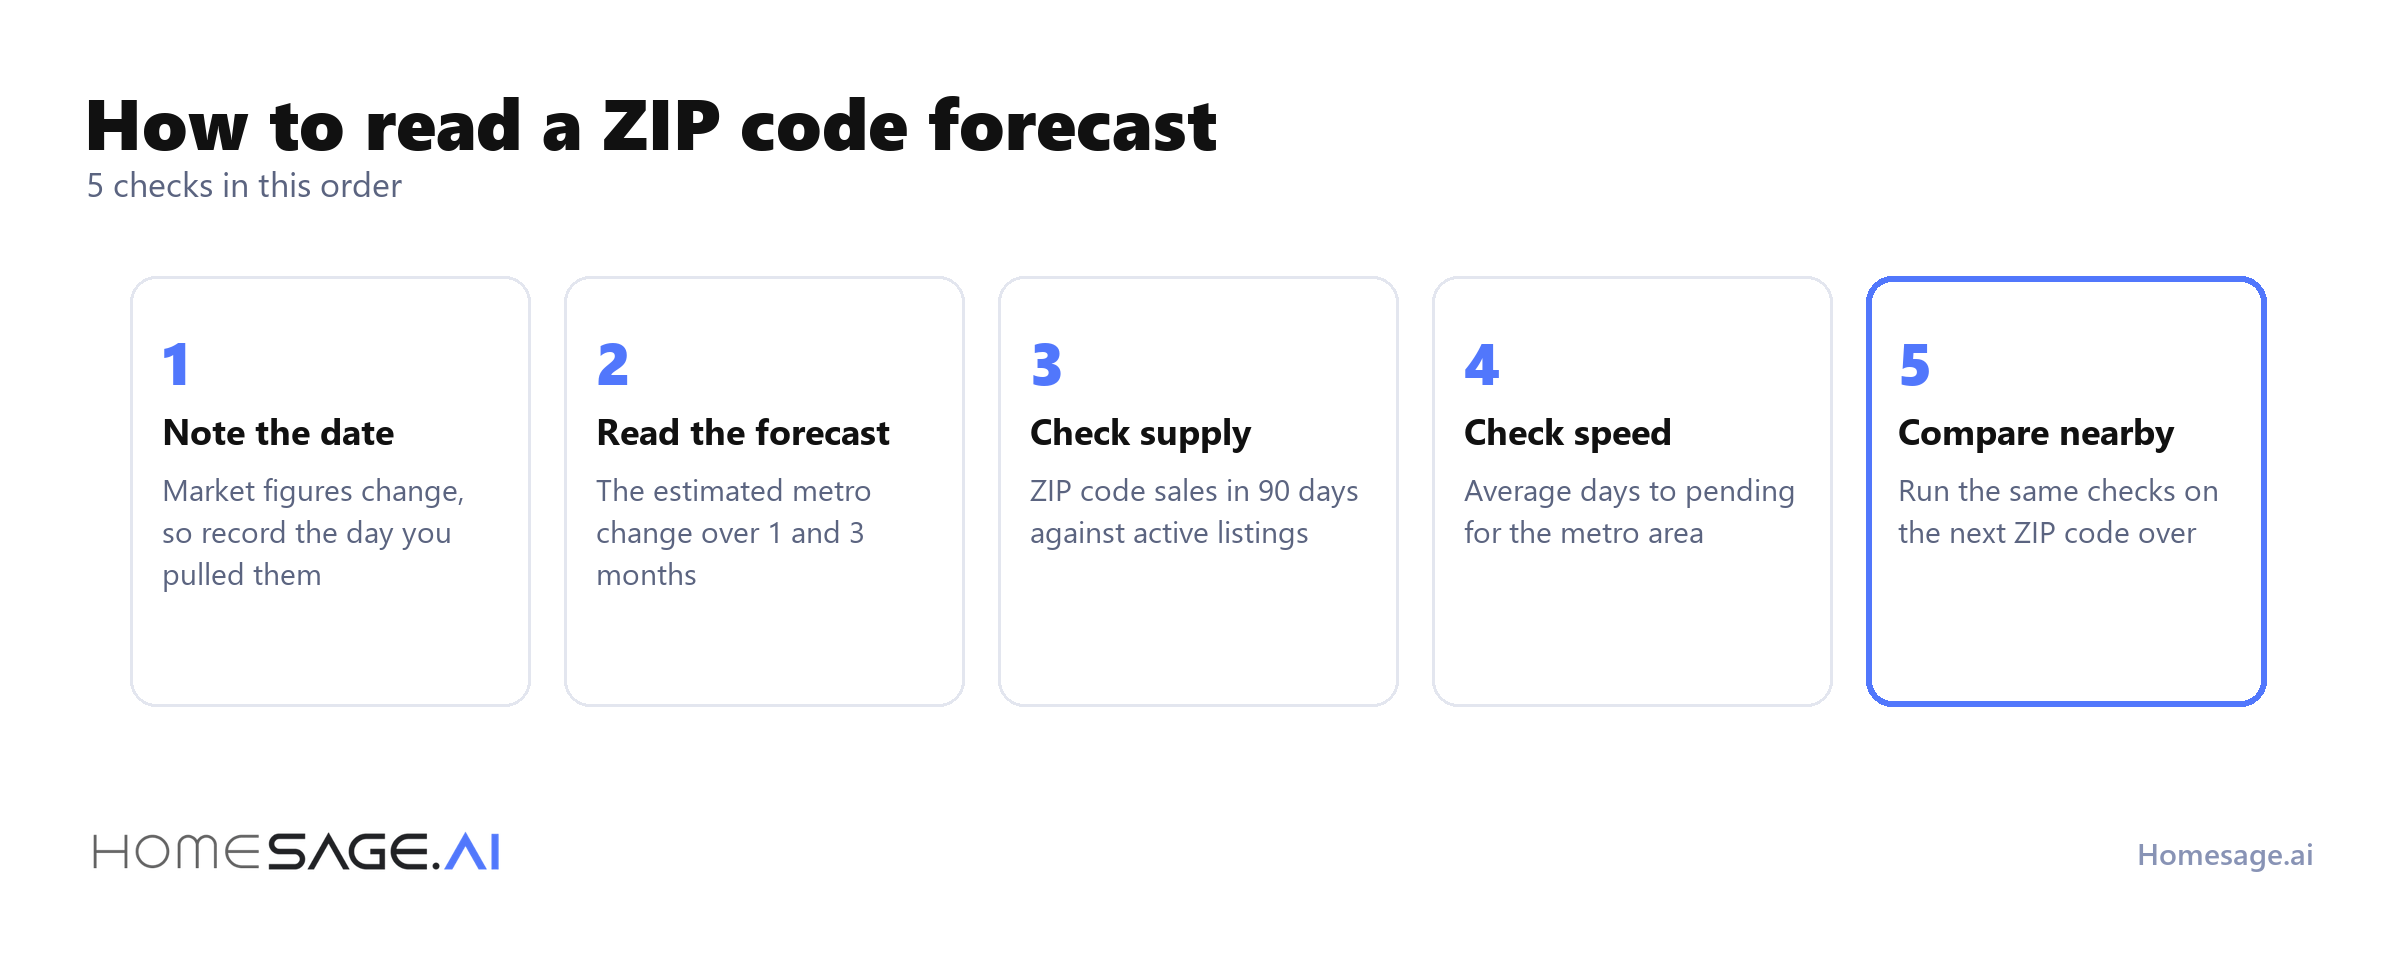
- Note the date. Market figures change, so record the day you pulled them.
- Read the estimated forecast first. It covers the metro area, so turn the 1-month and 3-month change into dollars on the price you plan to pay.
- Check supply. Absorption above 100% means the ZIP code sold more homes in the last 90 days than it has listed today.
- Check speed. Fewer days to pending means buyers move faster, and sellers have less reason to cut the price.
- Compare nearby. Run the same checks on the next ZIP code over before you set an offer or a sale price.
What moves a ZIP code forecast up or down
The forecast moves with the metro area. A single ZIP code can run ahead of its metro or fall behind it, so read the local sales next to the forecast.
Supply and speed move first. Atlanta 30318 had 384 active listings on 23 October, more than 3 times the 114 in Phoenix 85015. Phoenix metro homes took 62 days to go to pending, and each extra week adds holding costs for the seller.
Common market forecast mistakes to avoid
- Reading a metro forecast as a ZIP code forecast: The forecast and days to pending cover the metro area. Check the ZIP code's own sales and listings as well.
- Reading the score alone: The score is a summary. Check the forecast, absorption, and days to pending behind it.
- Treating the forecast as a promise: The forecast is an estimate. An estimated +0.9% over 3 months is about $1,485 on a $165,000 listing.
- Using old figures: Write down the date you pulled the forecast, and pull it again before you make an offer.
Frequently asked questions
Where can I see the forecast for my ZIP code?
Does the forecast cover my ZIP code or the whole metro area?
What does absorption mean in a market report?
What goes into the market score?
Should I wait to buy if the forecast is negative?
Ask Sage about the market in any ZIP code
Sage, our assistant, reads the market outlook for any US address from inside the AI tool you already use.
- Homesage.ai market outlook for Detroit (48214), Phoenix (85015), and Atlanta (30318), with metro market data current through 2026-09-30, pulled 2026-10-23.
- List prices from Homesage.ai Full Property Reports generated 2026-10-14.