This guide is for a buy-and-hold investor who wants a short list of ZIP areas to study. We ranked every US ZIP area with a clear rent and home value by one number: monthly rent divided by the median home value. We kept only ZIP areas with at least 20,000 people and a solid margin of error, so 5,268 areas made the list.
Homesage.ai reads public records, listings, and models on 160M+ US properties. Every figure on this page comes from the U.S. Census Bureau, so you can check it yourself.
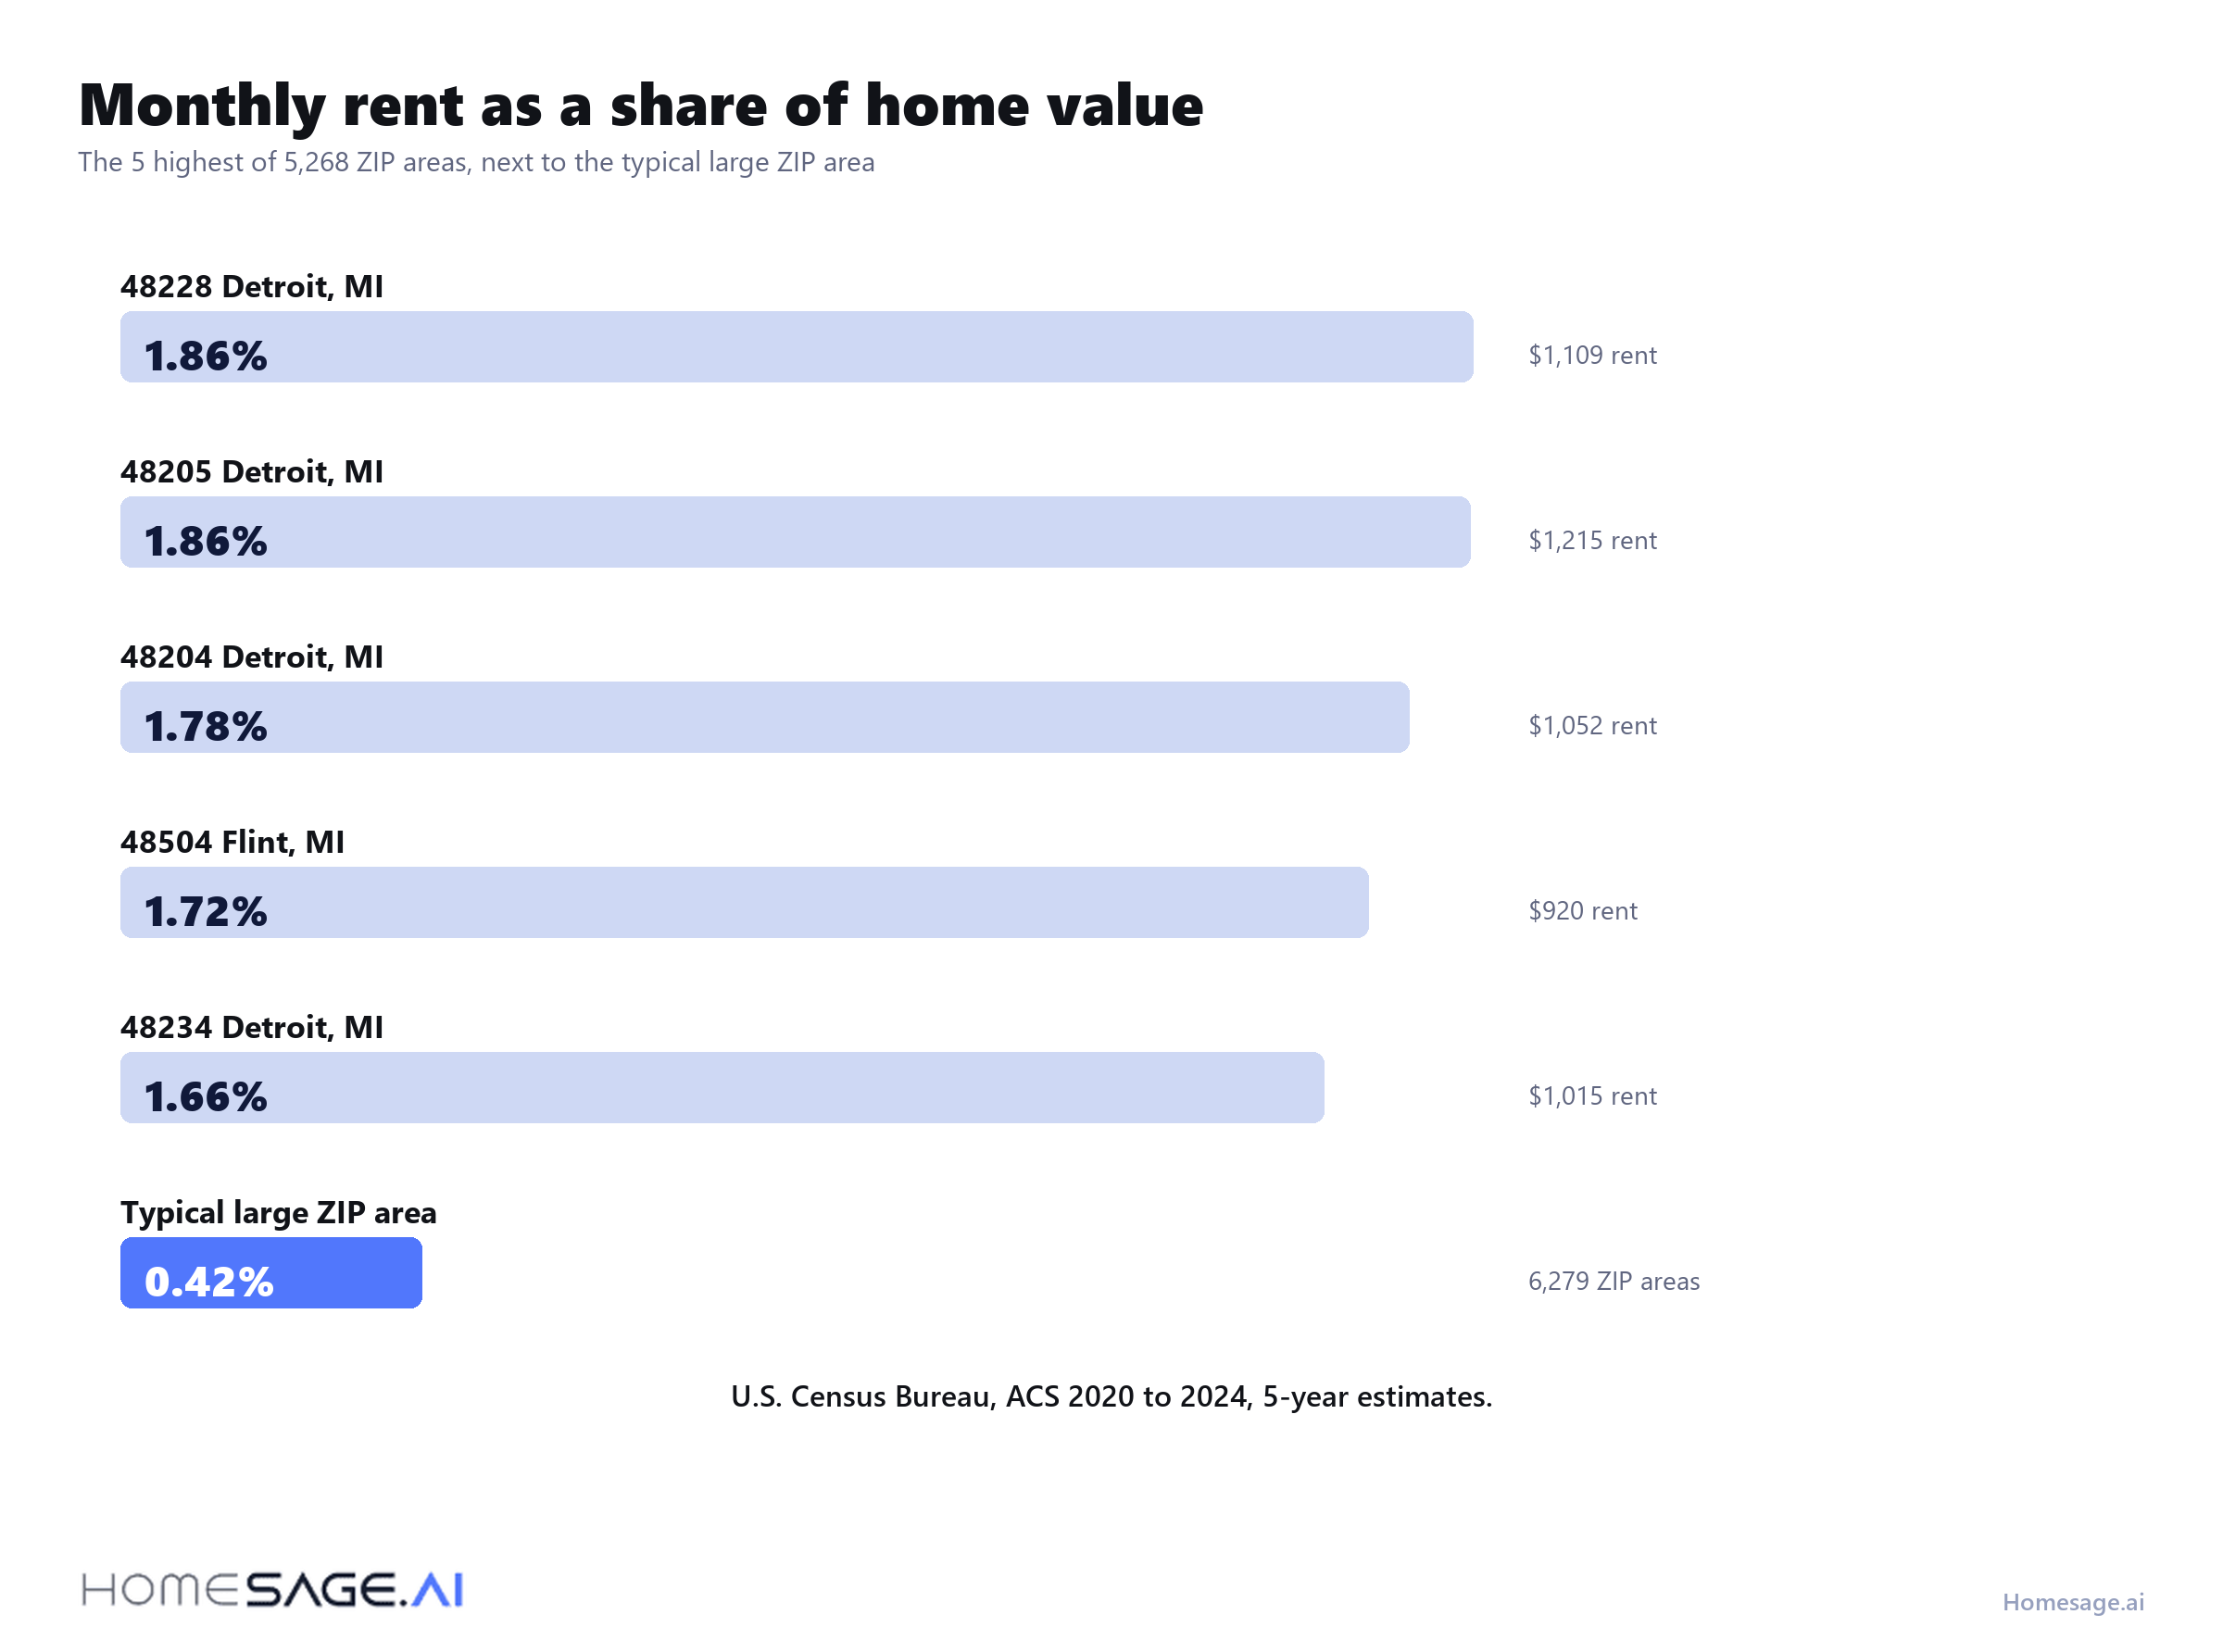
The 10 ZIP areas with the highest rent-to-price
9 of the top 10 are in Michigan. ZIP codes 48228 and 48205 in Detroit tie at 1.86%, which means a typical rent equals about 1.9% of the typical home value each month. The typical large ZIP area sits at 0.42%.
| ZIP | City | Median rent | Median home value | Rent as % of value | People |
|---|---|---|---|---|---|
| 48228 | Detroit, MI | $1,109 | $59,500 | 1.86% | 50,117 |
| 48205 | Detroit, MI | $1,215 | $65,300 | 1.86% | 34,187 |
| 48204 | Detroit, MI | $1,052 | $59,200 | 1.78% | 20,696 |
| 48504 | Flint, MI | $920 | $53,500 | 1.72% | 24,218 |
| 48234 | Detroit, MI | $1,015 | $61,200 | 1.66% | 32,760 |
| 48238 | Detroit, MI | $1,010 | $64,800 | 1.56% | 24,731 |
| 44105 | Cleveland, OH | $931 | $61,400 | 1.52% | 32,115 |
| 48141 | Inkster, MI | $1,170 | $80,400 | 1.46% | 25,428 |
| 48210 | Detroit, MI | $976 | $67,800 | 1.44% | 26,722 |
| 48224 | Detroit, MI | $1,224 | $88,700 | 1.38% | 39,668 |
Source: U.S. Census Bureau, American Community Survey 2020 to 2024, 5-year estimates. Rent is median gross rent per month. Value is the median value of owner-occupied homes.
The best ZIP area in 10 different cities
The top 10 is crowded with Detroit. This second view keeps only the best ZIP area in each city, so you see where else the numbers are strong.
| City | Best ZIP | Median rent | Median home value | Rent as % of value |
|---|---|---|---|---|
| Detroit | MI, 48228 | $1,109 | $59,500 | 1.86% |
| Flint | MI, 48504 | $920 | $53,500 | 1.72% |
| Cleveland | OH, 44105 | $931 | $61,400 | 1.52% |
| Inkster | MI, 48141 | $1,170 | $80,400 | 1.46% |
| Maple Heights | OH, 44137 | $1,338 | $98,100 | 1.36% |
| Toledo | OH, 43609 | $873 | $65,500 | 1.33% |
| Memphis | TN, 38106 | $952 | $71,800 | 1.33% |
| Chester | PA, 19013 | $1,099 | $83,700 | 1.31% |
| Jackson | MS, 39209 | $1,010 | $78,400 | 1.29% |
| Saginaw | MI, 48602 | $933 | $73,600 | 1.27% |
Test one house in these ZIP codes
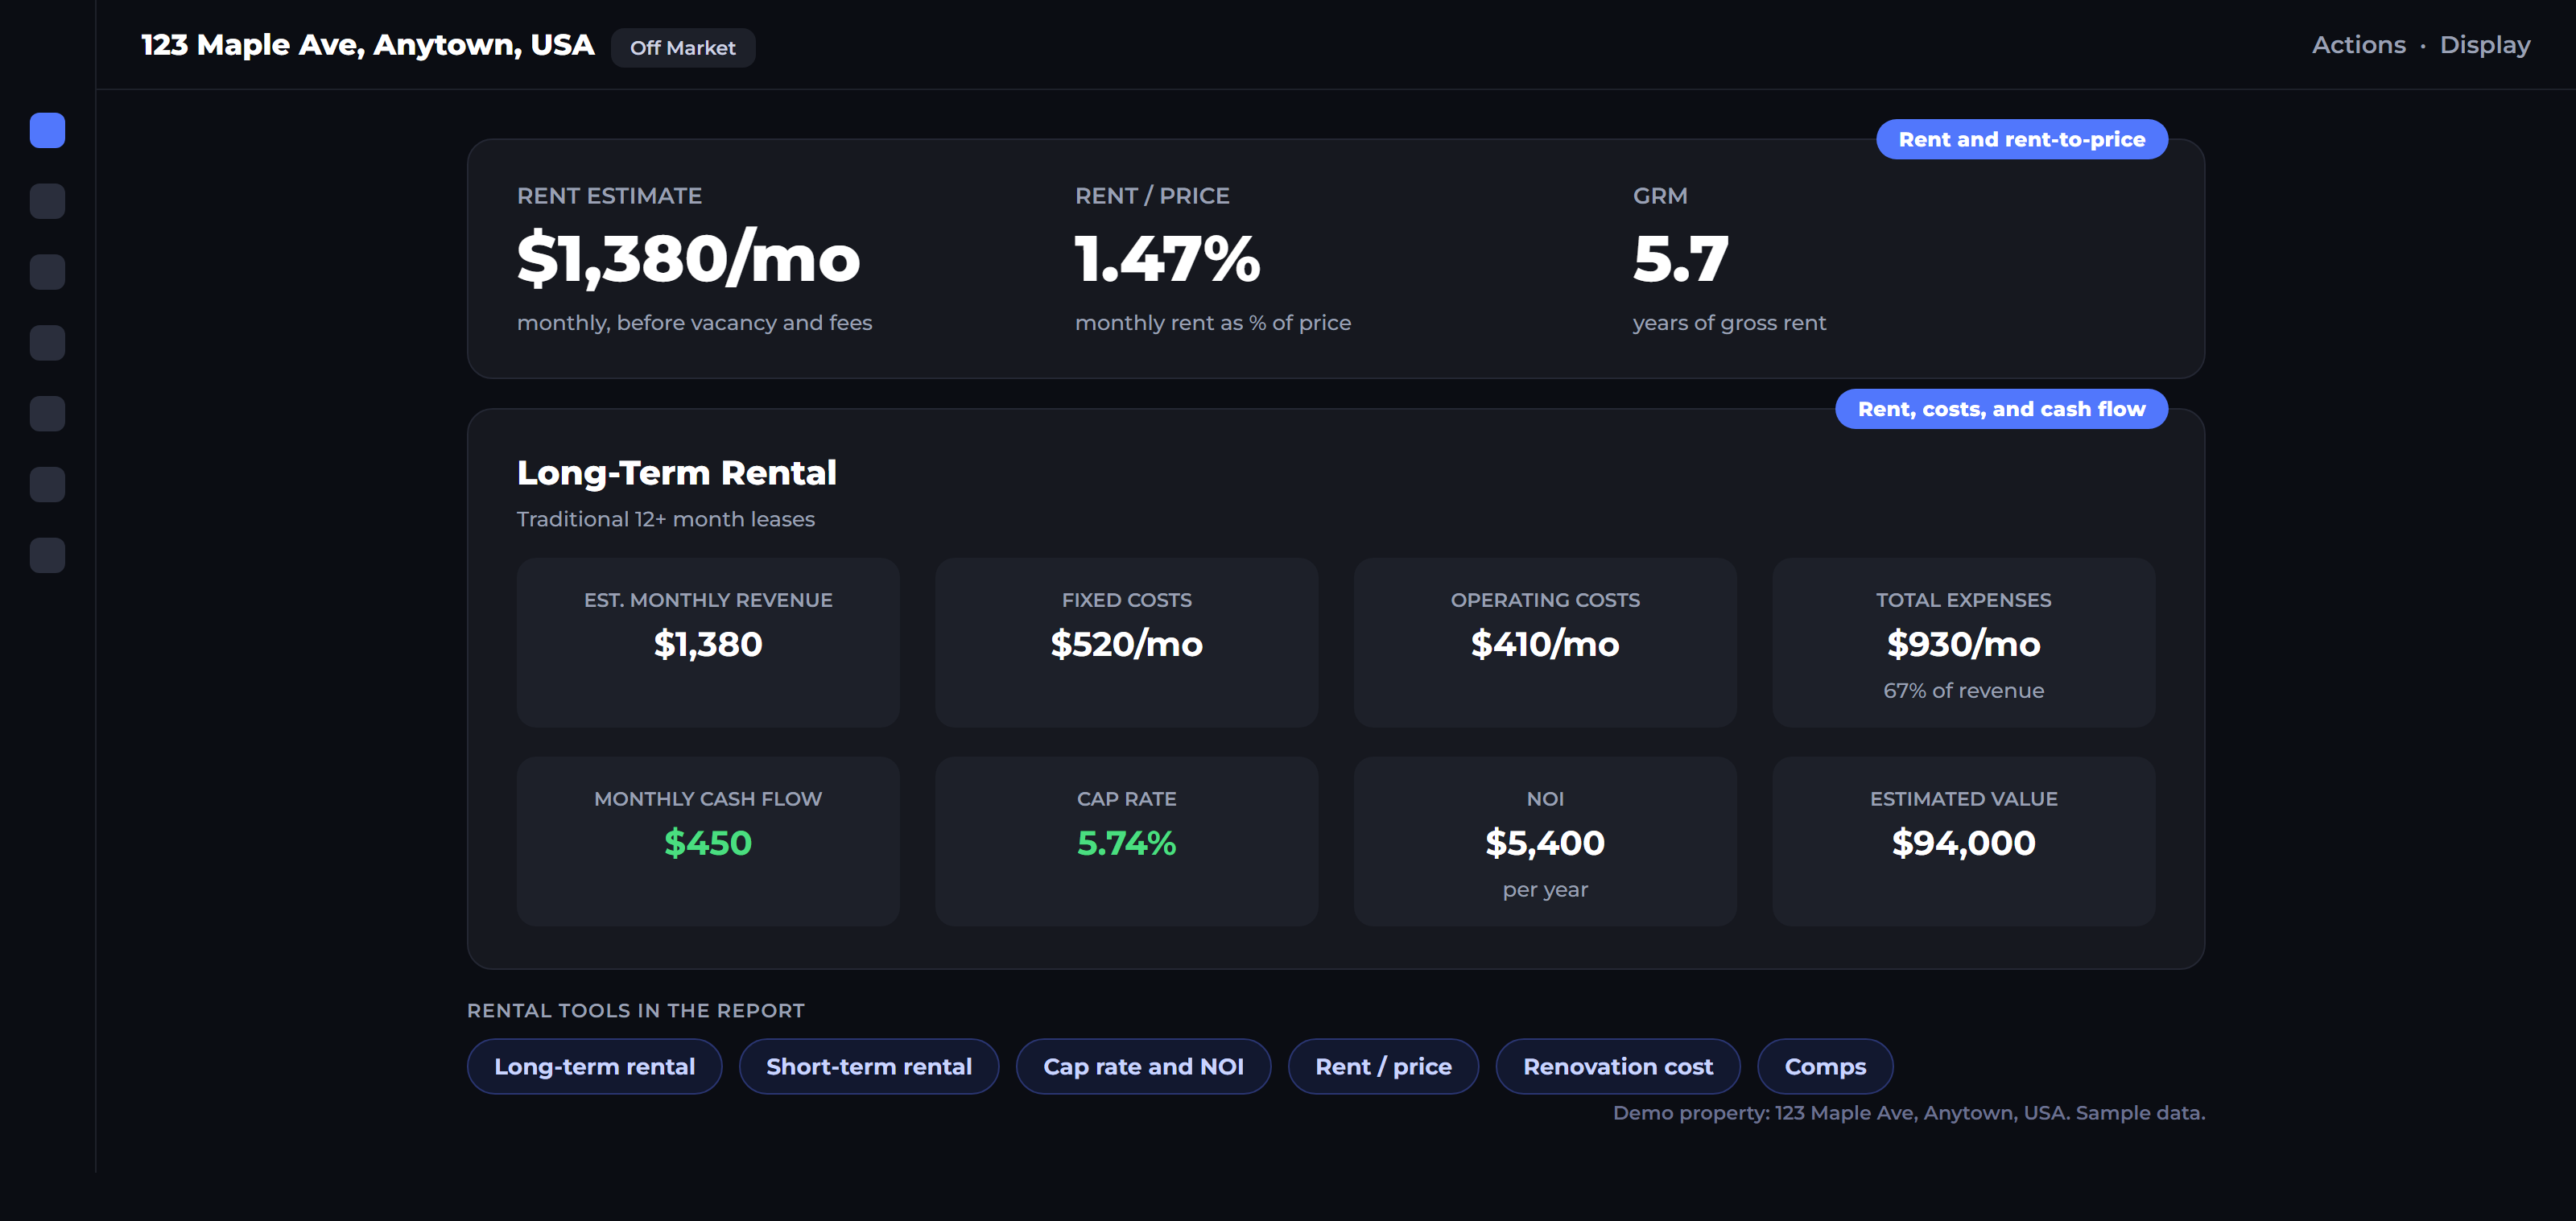
A ZIP median is a start. A Full Property Report gives value, comparable sales, rent estimates, and renovation cost for one address.
How we ranked the ZIP areas
We started with 25,264 ZIP areas that have both a median rent and a median home value. We kept the ones that pass 3 tests.
- At least 20,000 people, so one block cannot swing the result.
- A margin of error of 10% or less on both rent and value.
- A median home value of at least $50,000, to drop places with too few real sales.
For each ZIP area we divided the median monthly rent by the median home value. Of 6,279 ZIP areas with 20,000 or more people, 64 reach 1%, which is 1.0%. Our guide to the 1% rule explains how investors use that line.
Why a high ratio is not cash flow
Take ZIP 48228, in Detroit. The median rent is $1,109 a month, or $13,308 a year, on a median value of $59,500. That is 22.4% of value a year before any cost.
Now subtract what an owner pays. Property tax, insurance, repairs, a property manager, and months with no tenant all come out of that rent. Many investors use a rule of thumb that costs take about half of the rent. It is a guide, not a fact for any one house. To work through every cost, see our guide on how to calculate cash flow on a rental property.
Low prices also hide risk. These ZIP areas often have older homes, more vacancy, and higher repair bills. A cheap house with a big repair list can erase a strong ratio.
How to use this list
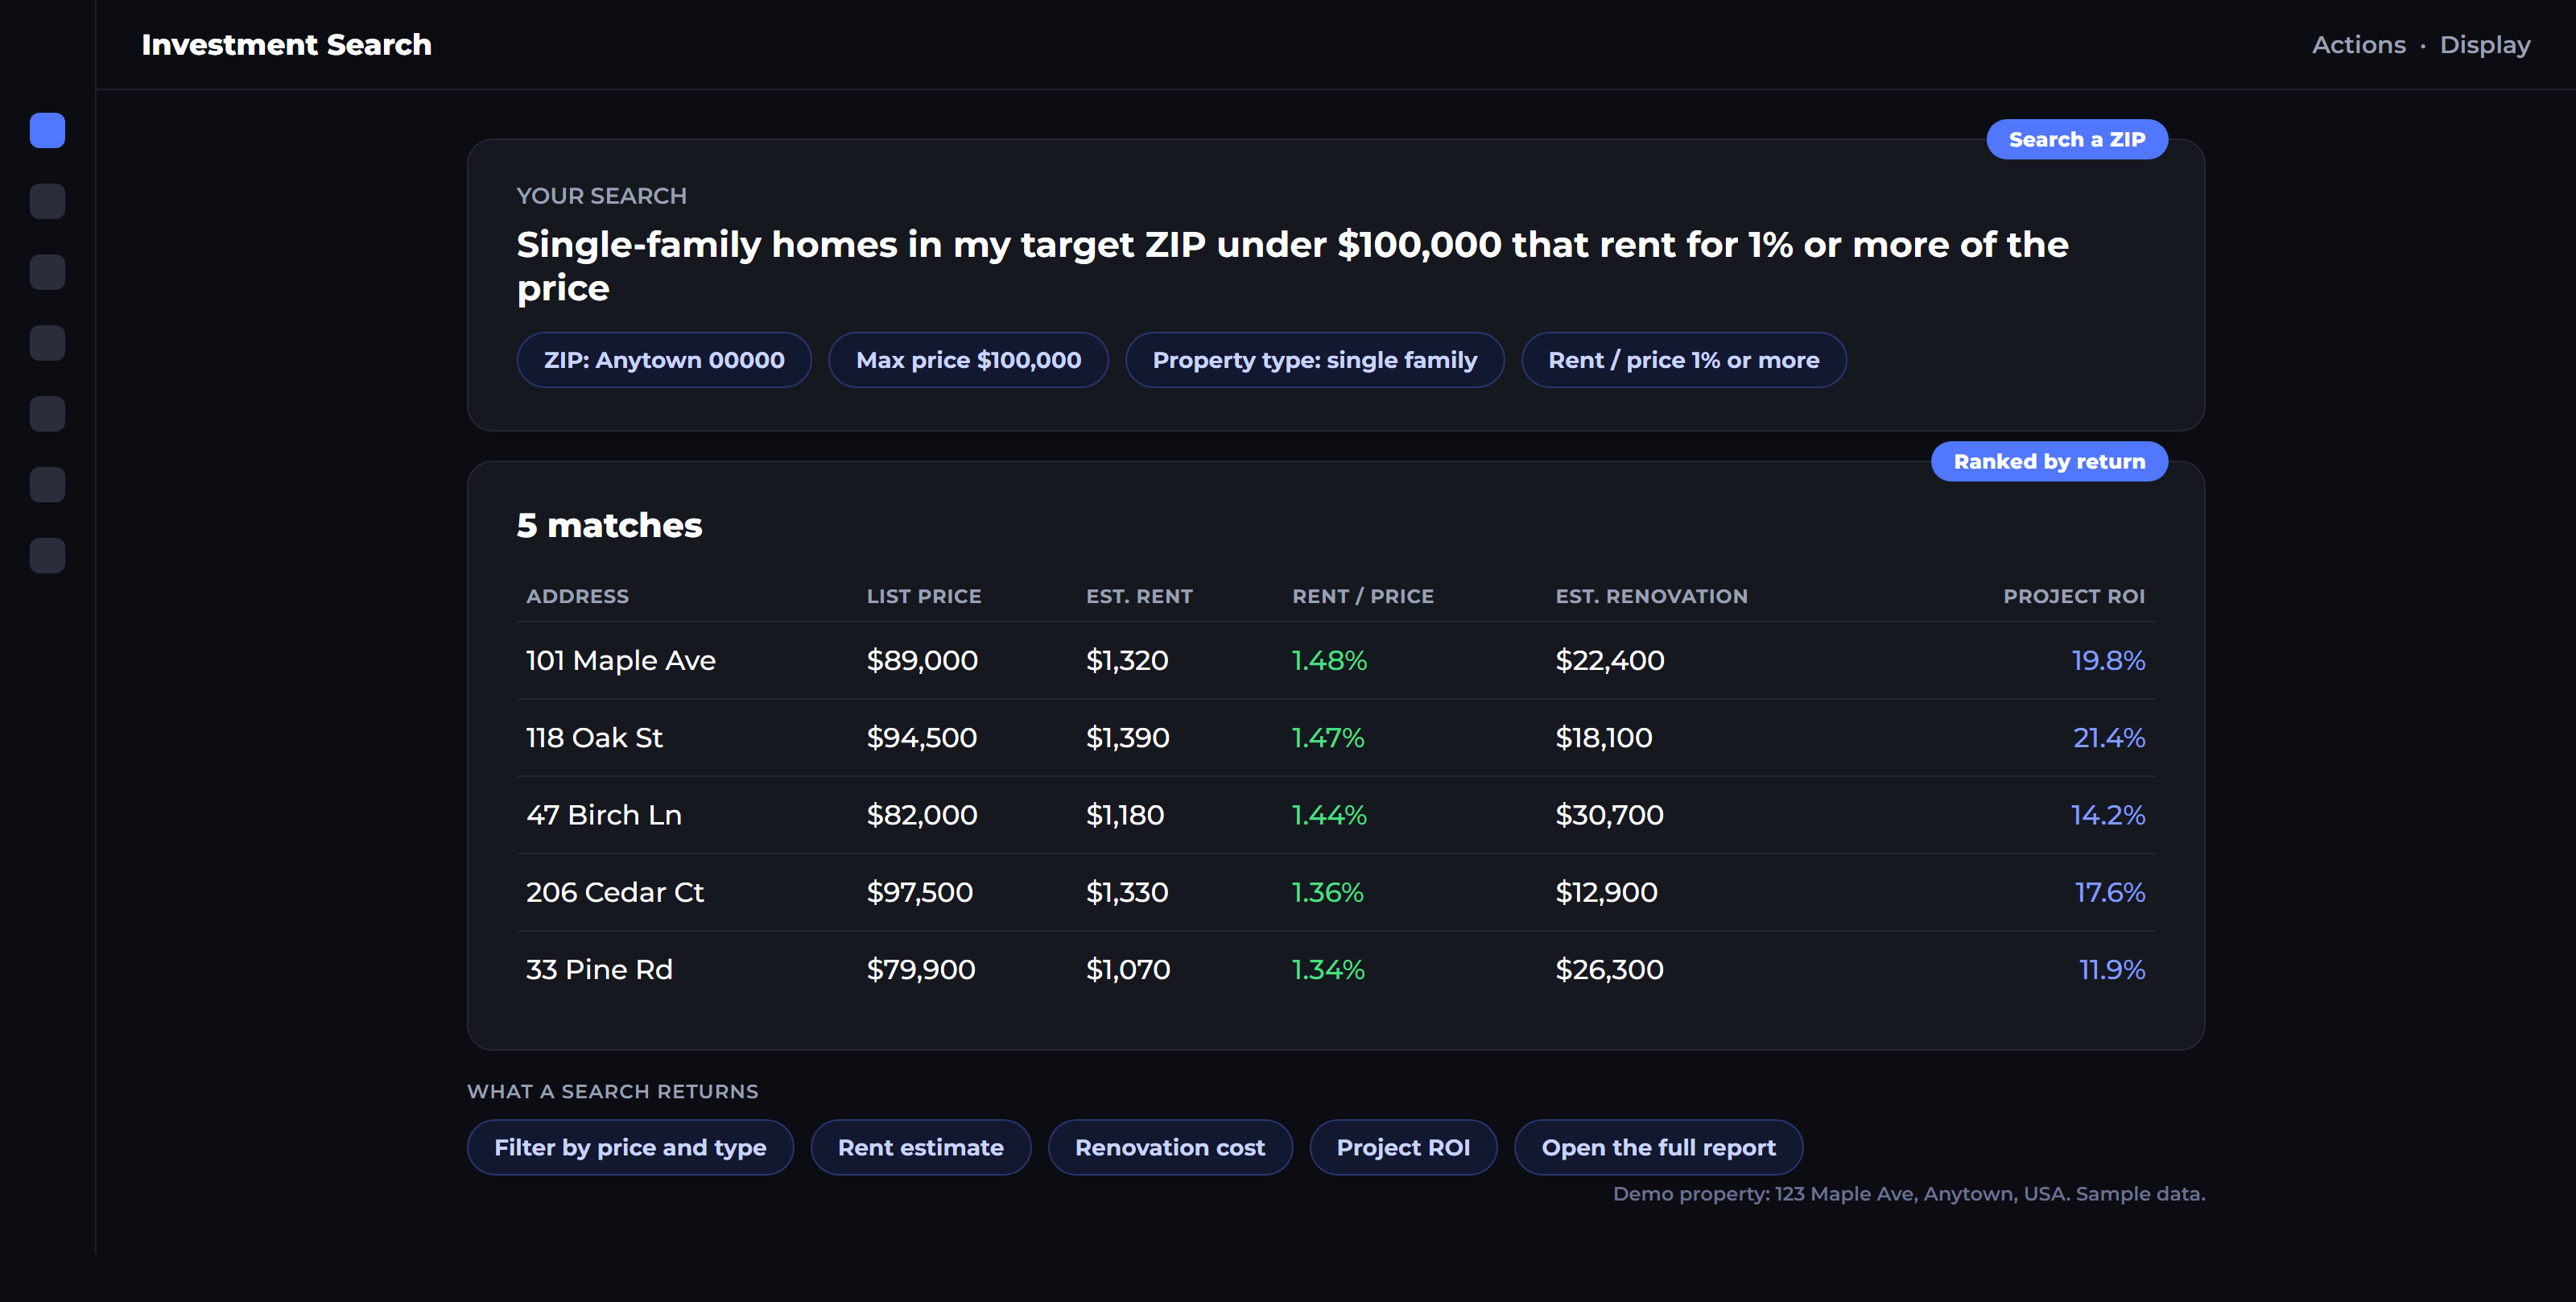
- Pick 2 or 3 ZIP areas from the tables and study them, not just the top row.
- Look at current listings and recent sales in that ZIP, not only the Census median.
- Price the repairs for one real house and add taxes, insurance, and a vacancy allowance. Our rental ROI guide shows the steps.
- Compare the result with a market where prices are higher and the home is easier to rent and sell.
This list is a math screen. It is not advice about where any person should live or buy. Treat every buyer and renter the same, and follow fair housing law in your own marketing and screening.
What the Census numbers can and cannot tell you
The American Community Survey is a sample survey, so every figure is an estimate. Median value comes from owners who describe their own homes. Median gross rent includes utilities that the renter pays. ZIP areas here are Census ZIP Code Tabulation Areas, which closely match, but do not equal, US Postal Service ZIP codes.
The 2020 to 2024 estimates average five years of surveys. They show the long view, not this month’s asking rents. Use them to build a shortlist, then check live data.
Key takeaways
- We ranked 5,268 US ZIP areas by monthly rent divided by median home value.
- ZIP codes 48228 and 48205 in Detroit are first, at 1.86% each, and 9 of the top 10 are in Michigan.
- The typical large ZIP area sits at 0.42%, and only 1.0% of large ZIP areas reach 1%.
- A high ratio is gross rent. Taxes, insurance, repairs, and vacancy still come out of it.
- Use the list to build a shortlist, then check one real house in each ZIP area.
Conclusion
The ZIP areas with the highest rent compared with price are in Detroit, Flint, Cleveland, and a few other older industrial cities. The best two reach 1.86% a month, against 0.42% for the typical large ZIP area.
Today, pick 2 or 3 ZIP areas from the tables and look at what is for sale there now. Price the repairs on one real house and add taxes, insurance, and vacancy. Then see if the rent still works.
A Homesage.ai Full Property Report gives value, comparable sales, rent estimates, and renovation cost for one home, from data on 160M+ US properties. Use it to turn a ZIP median into a number for one address.
Turn a ZIP median into one deal
Check value, rent, and renovation cost for one address before you make an offer.
Frequently asked questions
What is the 1% rule in real estate?
What is a good rent-to-price ratio?
Does a high rent-to-price ratio mean cash flow?
Which ZIP codes have the highest rent compared with price?
How often do you update this page?
Published 19 November 2026. Data from the U.S. Census Bureau, read 19 November 2026. Estimates only. Not legal, lending, or investment advice. Owner: Homesage Team. Next update: December 2026, when the Census Bureau releases new five-year data.